

According to Quintegia’s 2026 Dealer Network Study, the Italian automotive retail sector continues to consolidate, with fewer entrepreneurs operating in the market while territorial coverage remains stable and emerging brands expand their presence across dealerships.
Italy’s automotive distribution network currently includes 3,794 franchise dealerships, nearly one-third of which (31%) are located in the country’s Northwest region. Quintegia’s Dealer Network Study, which analyzes the organization of traditional passenger car and light commercial vehicle brand networks in Italy, also maps the geographical distribution of dealerships and how they cover the national territory.
Lombardy leads the country in terms of dealership density, with 692 franchise locations — roughly one dealership for every 14,500 residents across a population of more than 10 million people. In Lazio, Italy’s second most populous region with 5.7 million inhabitants, there is one dealership for every 20,000 residents (282 outlets in total). In Campania, home to 5.57 million people and the country’s third-largest regional population, the ratio rises to one dealership for every 30,000 inhabitants. Tuscany, by contrast, counts 353 dealerships serving 3.6 million residents, equivalent to roughly one dealership per 10,000 people.
Fewer entrepreneurs and legal entities
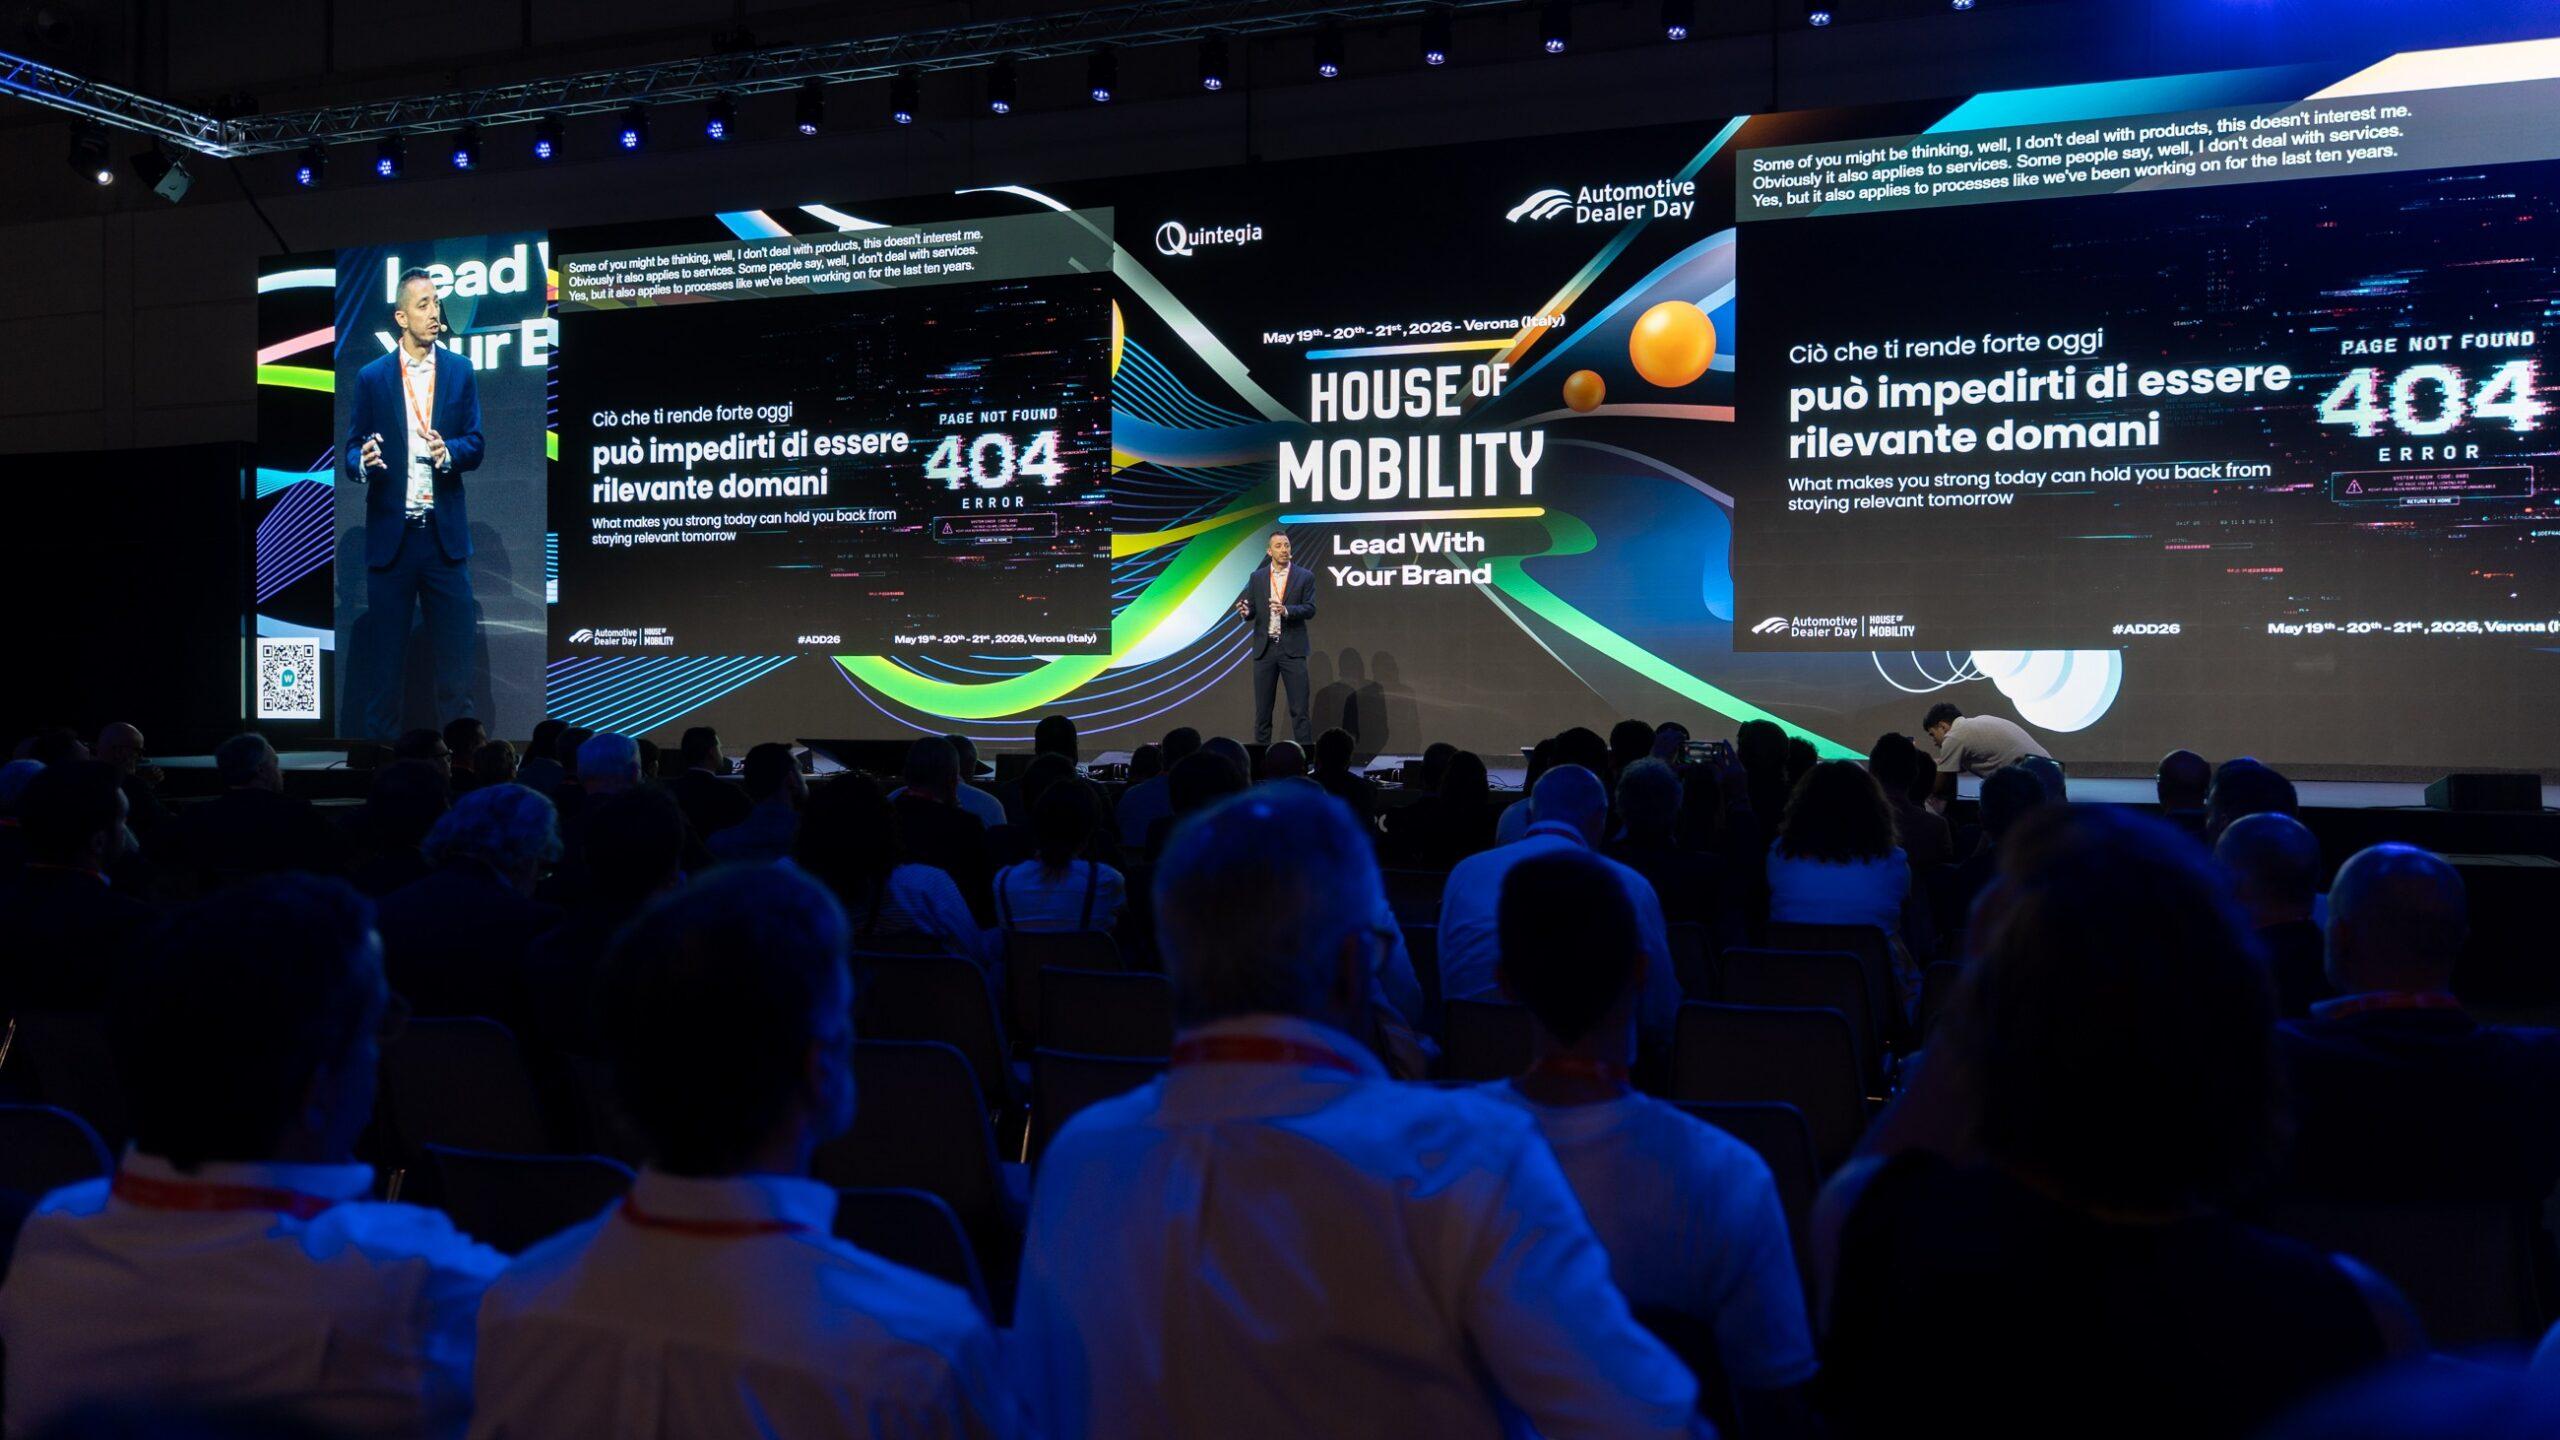
The study, some of whose findings will be presented during the upcoming Automotive Dealer Day – House of Mobility, scheduled to take place at Veronafiere from May 19 to 21, shows that after a period of relative stabilization, 2026 marks a return to contraction within the authorized sales network.
The decline mainly affects the number of entrepreneurs, which fell to 710 (-5% compared to 2025), and the number of legal entities, down to 895 (-6%). The reduction in physical sales outlets is less pronounced: company-owned sites decreased by 2% to 2,200 units, while franchise locations remained substantially stable.
The ongoing consolidation of the network — also driven by mergers and acquisitions — becomes even more apparent when looking at the medium- to long-term trend. Compared to 2016, the distribution network has undergone a significant downsizing: the number of entrepreneurs has dropped by 41%, while physical dealership locations have declined by as much as 23%.
A similar trend can be observed within the aftersales network. Here too, Quintegia’s Dealer Network Study highlights a reduction in operators, with both entrepreneurs and legal entities down by 7%. Service locations, however, remain comparatively stable, particularly within the franchised network (9,146 facilities, down just 1%), reflecting a pattern similar to the sales network: fewer operators but a still widespread territorial presence.
This trend affects both authorized dealers and repairers, with declines ranging between -6% and -8%. The contraction therefore appears to be structural across the entire authorized automotive retail chain, impacting primarily the entrepreneurial base.
The light commercial vehicle segment also reflects similar dynamics: entrepreneurs declined to 376 (-5%) and legal entities to 445 (-5%), while points of sale remained relatively stable (physical outlets -2%, franchise outlets -1%).
The rise of emerging brands
At the same time, Quintegia’s study highlights the growing strength of the multi-brand, multi-manufacturer dealership model. The share of operators representing brands from multiple automakers has increased to 44% of the market, up from 40% in 2025 and 31% in 2016, while single-brand dealerships continue to lose ground.
Traditional dealerships representing only one automotive brand accounted for 51% of the market in 2016, but their share has fallen steadily to 35% in both 2025 and 2026.
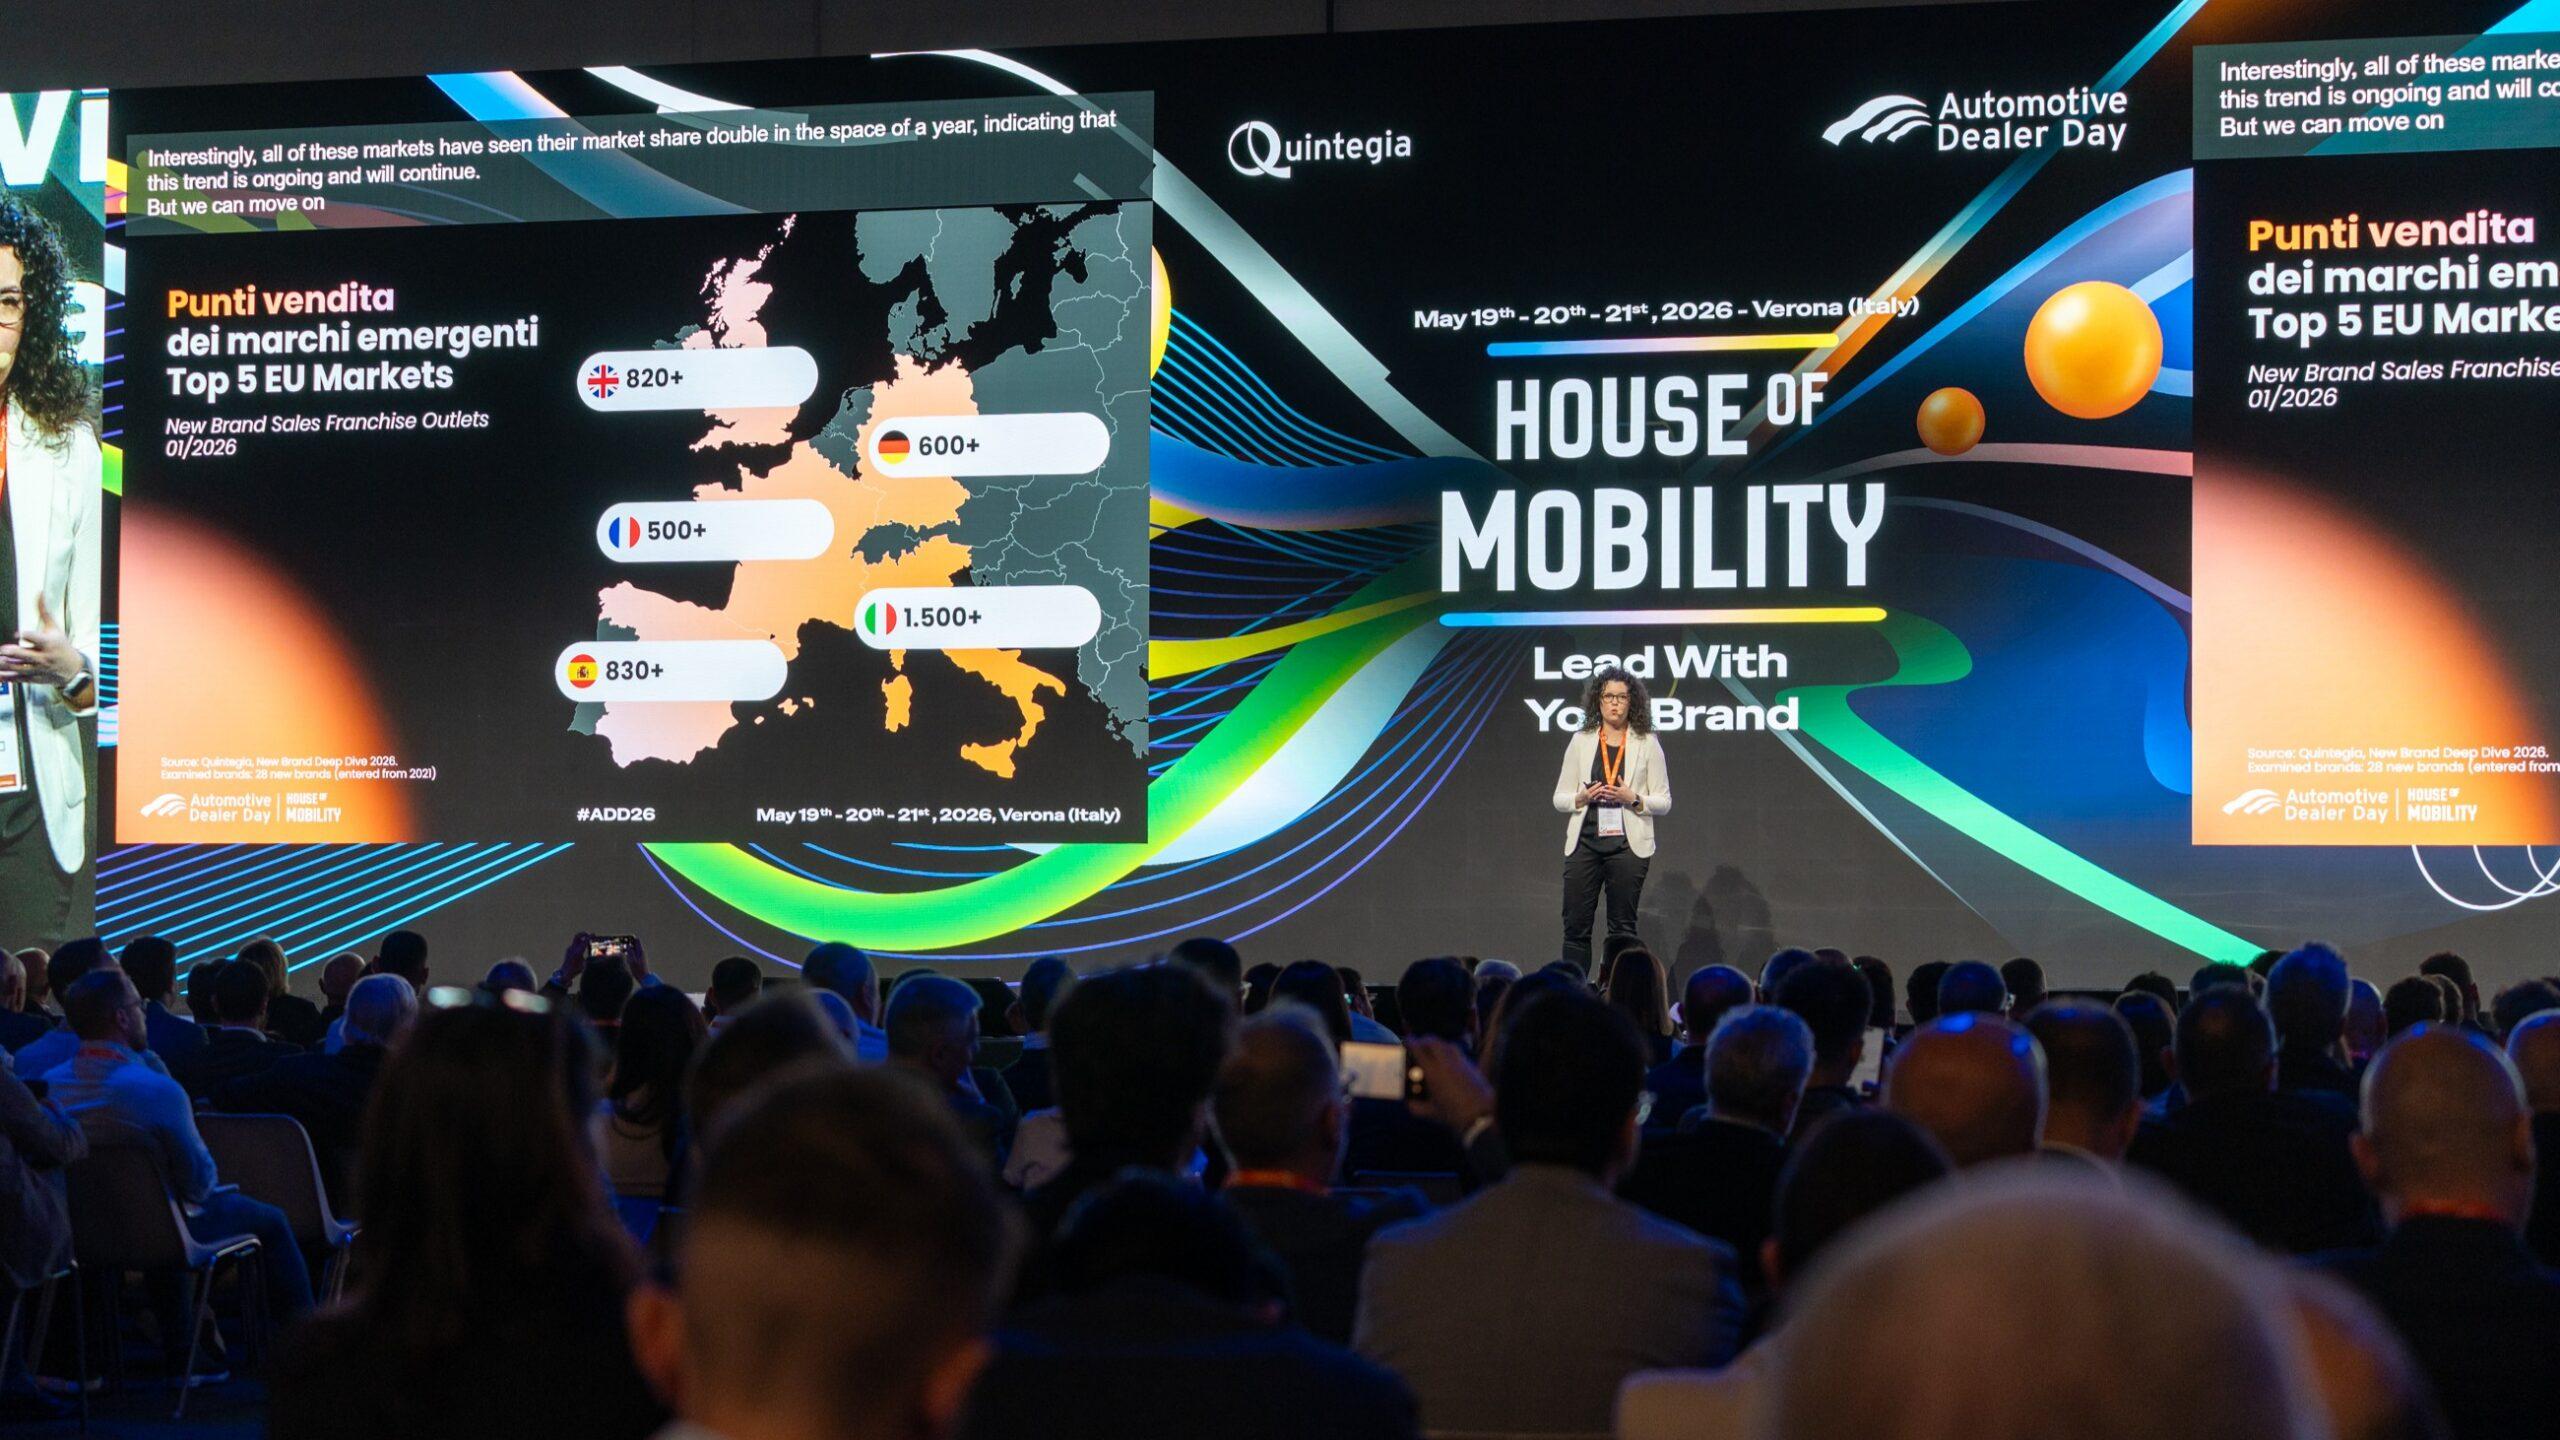
The most dynamic trend, however, concerns emerging brands — most of them Chinese manufacturers. In 2022, each entrepreneur represented an average of 2.47 brands. By 2026, considering only traditional brands, the average falls slightly to 2.38. When emerging brands are included, however, the figure rises significantly to 3.45 brands per operator.